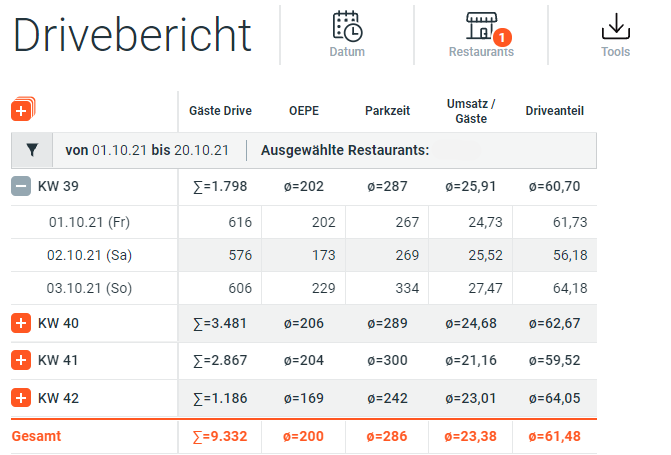
Description key figures
- Number of cars
- Average Service Time
- Average Park time
- Sales per car
- Drive ratio
In addition, weekly subtotal / sub average and a total / average for the whole time span selected are shown. At the bottom of the report a chart shows the number of cars for the selected time span.
Column Details
| Name | Unit | Description |
|---|---|---|
| Drive Guest Count | # | Drive Guest Count |
| OEPE | Seconds, for each day and average | OEPE is computed as [OEPE * Drive Guest Count] |
| Park Time | Seconds, for each day and average | Park Time is computed as [Park Time * Cars Parked] |
| Sales / Car | Decimal, Currency | Sales Per Guest is computed as [Drive Sales / Drive Guest Count], (gross or net depends on the organisation's setting) |
| Drive % | % | Drive Share is computed as the Drive Sales percentage from Product Gross Sales, (gross or net depends on the organisation's setting), [Drive Sales / Product Gross * 100] |