Description
The report provides an overview of theoretical and actual raw product stocks and consumption.
Each product can be unfolded to view the increase and decrease.
Views
All
Products for one restaurant/month grouped by daily, weekly or monthly counted products
TOP 10
Products for a restaurant/month with the same grouping sorted by difference quantity or difference value
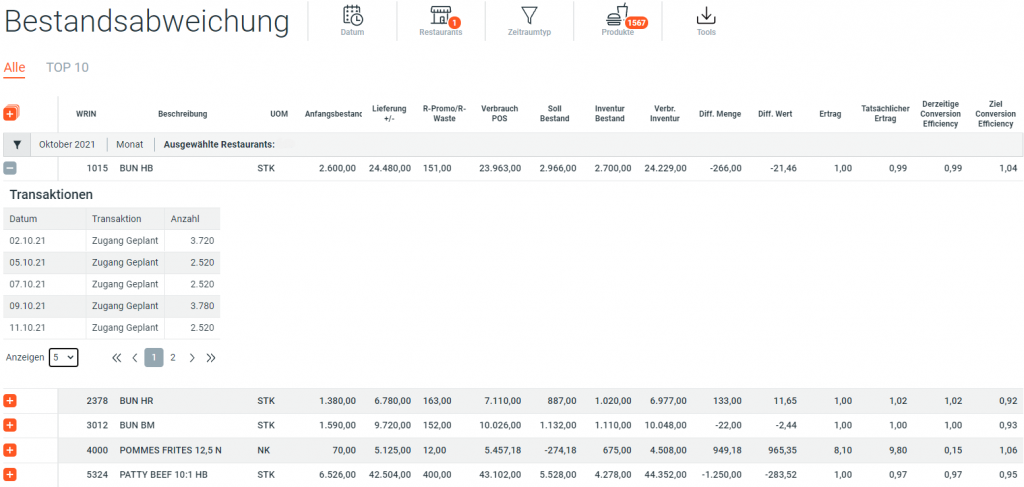
Column Details
| Name | Unit | Description |
|---|---|---|
| WRIN | Unique number | WRIN Number, it is composed at runtime |
| Description | String | Product Description |
| UOM | - | Unit of measure |
| Opening Stock | Decimal | Opening Stock of the month |
| Delivery +/- | # | Number of products delivered (inflow / outflow) |
| R-Promo/R waste | Decimal | Number Promo and Waste |
| Usage POS | Decimal | Consumption calculated from POS sales and back office recipes |
| Target Stock | Decimal | Target Stock (Calculated from the above figures) |
| Closing Stock | Decimal | Stock according to inventory count |
| Usage Inventory | Decimal | Consumption calculated according to inventory count |
| Diff. Amount | Decimal | Difference between Target Stock and Inventory Stock |
| Diff. Value | Decimal, Curreny | Inventory difference monetary value, calculated as Diff. Amount * Price per unit |
| Yield | Decimal | Product Yield |
| Actual Yield | Decimal | [((Usage POS + R-Promo/R waste) / (Usage Inventory + R-Promo/R waste)) * Yield] |
| Actual Conversion Efficiency | Decimal | [Usage POS / (Usage Inventory * Yield)] |
| Target Conversion Efficiency | Decimal | [(Inventory Stock - Opening Stock + Delivery) / (Sales In + Sales Out)] |