Description
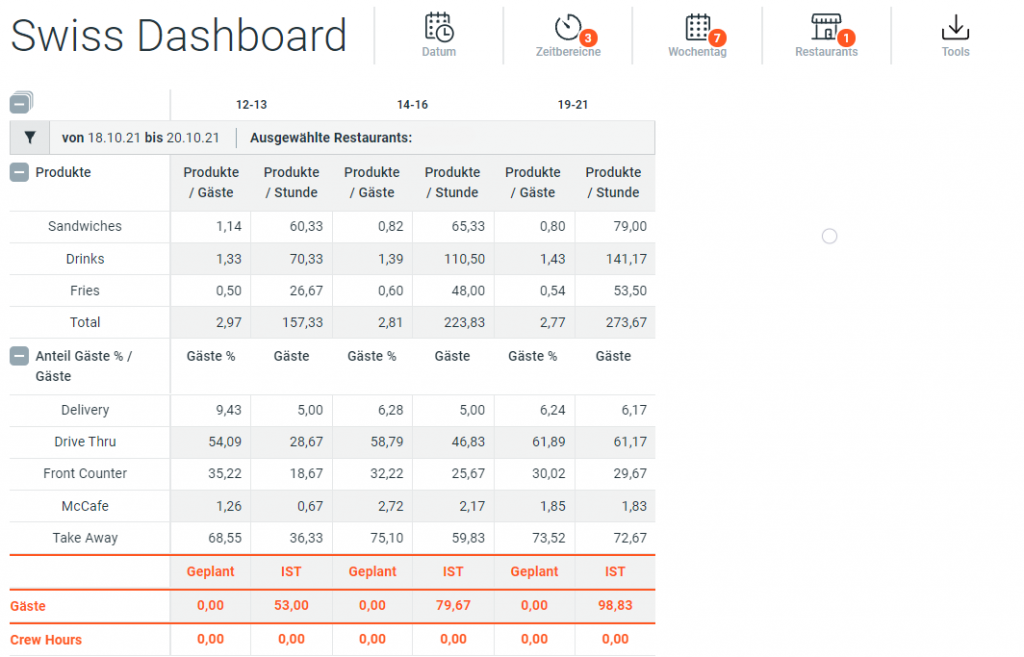
The upper part of the report shows the PMX sales of the individual product groups per time of day and the distribution of guests to the individual restaurant areas. The lower part compares the planned guests and crew hours with the actual ones.
The individual product groups and the existing restaurant areas can be viewed by opening them.
Row Details
| Name | Unit | Description |
|---|---|---|
| Items | String | Three product groups: Sandwiches, Drinks, Fries |
| Items / GC | Decimal | Items per guest |
| Items / h | Decimal | Items per hour |
| GC Share % / GC's | String | Drive Thru, Front Counter, RPS, SOK/NGK, Take Away |
| GC % | % | Share of guests |
| Planned | %, Decimal | Planned figures |
| Realized | %, Decimal | Realized figures |
| GC's | # | Guest Count |
| Crew Hours | Decimal | Crew Hours |